Analyzing 90s Turkish Pop Music
with Data Science!
We all Love 90s Turkish pop songs,
however, we don't know much about these masterpieces beyond beyond qualitative discussion and personal memories. Using data from the following Spotify playlist that contains most of the popular songs of the era, I took a deeper look at some of the characteristics of 90s Turkish pop music.
Spotify’s Public API lets you call data based on artist, album, song, playlist or related artist. Not bad for a 90s fan! It also gives us information about the mood of songs. For example, Spotify reports valence of a song, where valence is defined as “a measure ranging from 0.0 to 1.0 describing the musical positiveness conveyed by a track. Tracks with high valence sound more positive (e.g. happy, cheerful, euphoric), while tracks with low valence sound more negative (e.g. sad, depressed, angry).” Similarly, it reports energy, “a measure that ranges from 0.0 to 1.0 and represents a perceptual measure of intensity and activity. Typically, energetic tracks feel fast, loud, and noisy (closer to 1 on the energy-scale). For example, death metal has high energy, while a Bach prelude scores low on the scale. Perceptual features contributing to this attribute include dynamic range, perceived loudness, timbre, onset rate, and general entropy.”
Using these two metrics, I place 557 Turkish pop songs from the 90s on a graph you can find below. The chart is interactive — so have fun! Depending on the combination of each song’s valence&energy metrics, I place it in one of the following categories: angry, happy, sad, and peaceful.
Furthermore, colors of the data points show the popularity of a song on Spotify. Spotify defines the popularity metric as “a value will be between 0 and 100, with 100 being the most popular. The popularity is calculated by algorithm and is based, in the most part, on the total number of plays the track has had and how recent those plays are. Generally speaking, songs that are being played a lot now will have a higher popularity than songs that were played a lot in the past. Duplicate tracks (e.g. the same track from a single and an album) are rated independently. Artist and album popularity is derived mathematically from track popularity. Note that the popularity value may lag actual popularity by a few days: the value is not updated in real time.”
Let us take a closer look at the graph. It shows that the saddest two songs of the 90s are “Yoksun Sen” by Asya and “Elveda” by Askin Nur Yengi. I think this is spot-on! Youtube videos of each song is attached below. Do you agree?
Let’s cheer up! Looking at the upper-right corner of our graph, we see that the happiest three songs of the 90s are “Cukulata Kiz” by Ragga Oktay, “Yeniden Sev” by Nilufer, and “Koylu Guzeli” by Hakan Peker. I am not sure about Yeniden Sev; it is undoubtedly joyful - but it seems like a stretch to classify it as one of the happiest songs of the era. I think the lyrics might be significantly affecting my perception. Remember, Spotify classifies songs based on music - not lyrics. I certainly agree with the classification of Koylu Guzeli and Cukulata Kiz!!!
Youtube videos of each song are attached below. What do you think?
What about the most angry song? “Zehir Ettin” by Deniz Arcak. Home run!
What else can we do with Spotify’s Public API? Let us analyze the valence-density plots of of songs in three Turkish pop music queens’ albums: Sezen Aksu, Sertab Erener, and Nazan Oncel!
On the right, you can see the valence density of songs in five 90s Sezen Aksu albums. What is a density plot - how do we make sense of the graph on the right? The density plot shows the smoothed distribution of the songs' valence in each album. The peaks of the density plot are at the locations where there is the highest concentration of points.
If the plot's peak is on the left, it means that the albums predominantly include sad songs. In contrast, if the peak is on the right, it is safe to say it is a happy album. If the graph has two extremes, it means that the album includes both happy and sad songs.
The saddest album of Sezen Aksu in the 90s is "Deli Kizin Turkusu." No surprises here. Songs in "Dugun and Cenaze" are also predominantly sad. "Gulumse" seems to have a wide range of songs with different moods.

Let us look at Sertab Erener's albums. Sakin Ol is the happiest - and again, nor surprises. Compare Lal and Sakin ol on the graph on the right, and now think about all the songs in these two albums. Certainly, Lal songs are much sadder than those in Sakin Ol — and data confirm!

I thought the biggest surprise was with Nazan Oncel albums. Demir Leblebi seems to be the album with the “happiest” songs. Isn’t this weird — “Demir Leblebi” is known to be the harshest Nazan Oncel album? Once again, we see how lyrics can overwrite the sadness/happiness of the melody. If you start listening to “Demir Leblebi” without paying attention to lyrics, you will see that the songs' melodies are not very sad.

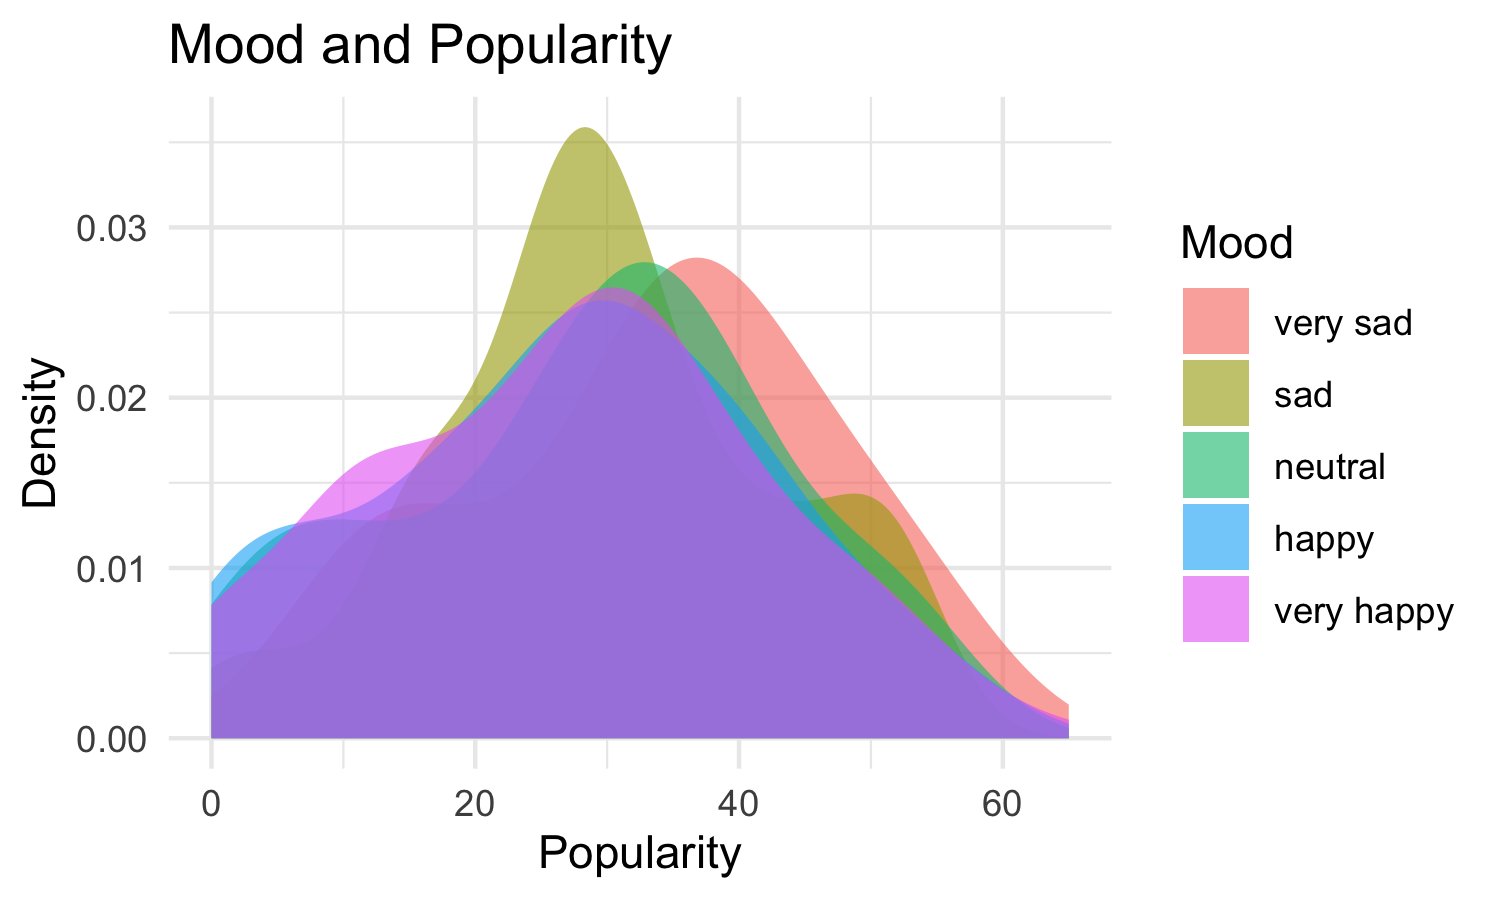
One last question to answer with data: why do we love the 90s so much? Do we listen to these songs to cry or to dance? Based on the valence metric, I group each piece into one of the following five categories: very sad, sad, neutral, happy, very happy. I then look at the density plot of each category’s popularity in Spotify. It seems that there are no very significant differences in popularity among categories. This shows that we love to cry while listening to these songs as much as we love to dance to them.